Maria
Freshman, Biology Major · 18
“I have 10 minutes between classes and I'm already lost.”
Needs
- Find classroom buildings quickly between classes
- Discover dining options and study spaces
Friction
Static maps don't show where I am
Shipped a student-led interactive campus map MVP with search, filters, and accessibility data across 35+ buildings.
Sponsored by a UX professor and department head, I led a 5-person student team to design and build an interactive campus map MVP, not the official university map at stedwards.edu. I owned the product experience from research through AI-assisted MVP launch and a final Spring branding pass before graduation.
Context
St. Edward's University's campus map was a static, 4MB illustrated PDF with no search capabilities. Students and visitors navigated a sprawling campus in the Texas heat with essentially a paper map on a screen. Content updates required a graphic designer, leaving building hours and accessibility information perpetually outdated or missing entirely.
On campus today
I proposed and led a campus wayfinding redesign at St. Edward's: search, filtering, and accessibility filters backed by a CSV data model. Shipped Fall 2025 and handed off after a final Spring 2026 iteration.
A student-led interactive campus map MVP shipped to campus in Fall 2025, with accessibility fields in the CSV data model and non-technical staff able to update content without code.
Impact (Before/After):
Before: A 4MB static PDF with zero search, filters, or accessibility data.
After (Student MVP): Deployed an interactive campus map MVP at kgdes.github.io/university-map for campus users to test search, filtering, and accessibility location data in the real world. This is not the official university map; it's a professor-sponsored student project.
Foundation Set: Built a CSV-driven content workflow so non-technical university staff can update building details without touching code, setting up the project for long-term success after my graduation.
Shipped Before Handoff:
Research
I owned research end to end, mixing quantitative and qualitative methods. I ran a Campus Navigation & Mapping Survey (40 responses via Google Forms) to size the problem, interviewed 3 stakeholders at kickoff, and wrote the interview protocol I moderated for all 10 student interviews: 5 before the MVP and 5 with new students on the live product after launch. Every fix I shipped traces back to something a participant did or said.
Students told me the #1 unmet need was not "better design." It was "tell me if there is an accessible entrance before I walk across campus in July heat." That single interview finding, not aesthetics, drove the information architecture.
I designed a mobile-first wayfinding app with a custom illustrated campus map and Google Maps for turn-by-turn directions:
Scope
Deliverable: A live, mobile-first wayfinding MVP shipped to campus in Fall 2025.
01 · Discover
Working within an agile intern team, I evaluated the existing map and owned research end to end. I started with a Campus Navigation & Mapping Survey (40 responses via Google Forms) to size the problem, then wrote the interview protocol and discussion guide and moderated every session myself: 3 stakeholder interviews at kickoff, 5 student interviews before the MVP, lo-fi prototype walkthroughs, and 5 more student interviews with new students on the live MVP after launch.
The surprising insight from the interviews wasn't about new students. It was staff:
"I've been here three years. I still don't know where half the buildings are." (Sarah, Administrative Coordinator)
And the #1 unmet need wasn't "better design." It was "tell me if there's an elevator before I walk across campus in July heat."
Working within an agile intern team, I evaluated the existing map and owned research end to end. I started with a Campus Navigation & Mapping Survey (40 responses via Google Forms) to size the problem, then wrote the interview protocol and discussion guide and moderated every session myself: 3 stakeholder interviews at kickoff, 5 student interviews before the MVP, lo-fi prototype walkthroughs, and 5 more student interviews with new students on the live MVP after launch.
The surprising insight from the interviews wasn't about new students. It was staff:
"I've been here three years. I still don't know where half the buildings are." (Sarah, Administrative Coordinator)
And the #1 unmet need wasn't "better design." It was "tell me if there's an elevator before I walk across campus in July heat."
02 · Define
Two archetypes drove the tradeoffs. Maria needed speed between classes; Alex needed accessibility data before making the trip.
Freshman, Biology Major · 18
“I have 10 minutes between classes and I'm already lost.”
Needs
Friction
Static maps don't show where I am
Junior, Uses wheelchair · 22
“I need to know if there's an accessible entrance BEFORE I get there.”
Needs
Friction
Accessibility info is never on maps
Two archetypes drove the tradeoffs. Maria needed speed between classes; Alex needed accessibility data before making the trip.
Freshman, Biology Major · 18
“I have 10 minutes between classes and I'm already lost.”
Needs
Friction
Static maps don't show where I am
Junior, Uses wheelchair · 22
“I need to know if there's an accessible entrance BEFORE I get there.”
Needs
Friction
Accessibility info is never on maps
03 · Ideate
Before building lo-fi prototypes, I had to separate two questions. What data could we ship in Fall 2025? and What detail actually solves Alex's problem?
I benchmarked Google Maps mall directories: search, filters, scrolling venue cards inside a building. Impressive depth, but too much for our launch window. Our CSV pipeline had entrance-level accessibility, hours, and services, not room-by-room inventory. Chasing a full directory drill-down would have delayed launch without helping the user who needs to know about an accessible entrance *before* crossing campus in July heat.
The scope call came first: surface building-level detail from CSV data, not build a mall-style room browser.
Design decision
Launch constraint · CSV pipelineWhat building detail matters most for the Fall MVP?
Answer the wayfinding question at building level before investing in room inventory you do not have.
Rejected
Right reference for depth, but our CSV only had entrance-level data; room drill-down would delay launch.
Selected
Hours, contact, description, and photos surfaced for every building, scoped to CSV data instead of a mall-style room browser.
Before building lo-fi prototypes, I had to separate two questions. What data could we ship in Fall 2025? and What detail actually solves Alex's problem?
I benchmarked Google Maps mall directories: search, filters, scrolling venue cards inside a building. Impressive depth, but too much for our launch window. Our CSV pipeline had entrance-level accessibility, hours, and services, not room-by-room inventory. Chasing a full directory drill-down would have delayed launch without helping the user who needs to know about an accessible entrance *before* crossing campus in July heat.
The scope call came first: surface building-level detail from CSV data, not build a mall-style room browser.
Design decision
Launch constraint · CSV pipelineWhat building detail matters most for the Fall MVP?
Answer the wayfinding question at building level before investing in room inventory you do not have.
Rejected
Right reference for depth, but our CSV only had entrance-level data; room drill-down would delay launch.
Selected
Hours, contact, description, and photos surfaced for every building, scoped to CSV data instead of a mall-style room browser.
04 · Prototype
With sheet depth locked, I built mid-fidelity wireframes across five interaction patterns and ran lo-fi prototype interviews. The question testing could answer: while walking on campus, how do users discover and reach filters?
Participants struggled with a scroll-down Quick Actions sheet: filters and popular locations hid behind expansion. They reached for thumb-zone controls instead.
Only after these sessions did we commit to quick filter chips plus a dedicated bottom-right filter menu.
Design decision
Lo-fi prototype testingHow do users reach filters while walking?
Quick chips for common cases; a bottom-right menu for popular locations and the full filter set.
View live campus mapRejected
Filters and popular locations hid behind scroll inside one expandable panel, hard to reach while walking.
Selected
Quick filter chips along the bottom plus a dedicated filter button, reachable without covering the map.
With sheet depth locked, I built mid-fidelity wireframes across five interaction patterns and ran lo-fi prototype interviews. The question testing could answer: while walking on campus, how do users discover and reach filters?
Participants struggled with a scroll-down Quick Actions sheet: filters and popular locations hid behind expansion. They reached for thumb-zone controls instead.
Only after these sessions did we commit to quick filter chips plus a dedicated bottom-right filter menu.
Design decision
Lo-fi prototype testingHow do users reach filters while walking?
Quick chips for common cases; a bottom-right menu for popular locations and the full filter set.
View live campus mapRejected
Filters and popular locations hid behind scroll inside one expandable panel, hard to reach while walking.
Selected
Quick filter chips along the bottom plus a dedicated filter button, reachable without covering the map.
05 · Design
Most campus maps treat accessibility as an afterthought: a small icon buried in a details page, if it exists at all.
My approach:
Accessibility data lives in the CSV schema (entrances, elevators, restrooms) and surfaces through dedicated search filters, not buried behind category browsing. Building detail sheets show hours and contact at the same visual level; accessibility-specific needs route through filters like gender-neutral restrooms and accessible entrances.
Validation:
I tested with 2 users with disabilities: one wheelchair user, one VoiceOver user. The wheelchair user said: "This is the first campus map I could actually use independently."
Technical accessibility:
Step 1 of 2
Search surfaces dedicated accessibility filters like gender-neutral restrooms, separate from category browsing.
Swipe to navigate
Most campus maps treat accessibility as an afterthought: a small icon buried in a details page, if it exists at all.
My approach:
Accessibility data lives in the CSV schema (entrances, elevators, restrooms) and surfaces through dedicated search filters, not buried behind category browsing. Building detail sheets show hours and contact at the same visual level; accessibility-specific needs route through filters like gender-neutral restrooms and accessible entrances.
Validation:
I tested with 2 users with disabilities: one wheelchair user, one VoiceOver user. The wheelchair user said: "This is the first campus map I could actually use independently."
Technical accessibility:
Step 1 of 2
Search surfaces dedicated accessibility filters like gender-neutral restrooms, separate from category browsing.
Swipe to navigate
06 · Deliver
After launch, I ran moderated usability testing on the live Fall MVP with new students. It surfaced three concrete fixes, and I implemented all three:
"Munday" returned no results because only "Munday Library" matched. Fix: added nickname matching across all buildings.
Some users missed the filter buttons entirely (gray-on-gray). Fix: increased contrast and added a subtle border.
Users tapped the collapsed bottom sheet to expand it, but the design only supported a swipe. Fix: added a tap-to-expand affordance.
Step 1 of 5
Autocomplete search with typo-forgiving nickname matching across buildings.
Swipe to navigate
After launch, I ran moderated usability testing on the live Fall MVP with new students. It surfaced three concrete fixes, and I implemented all three:
"Munday" returned no results because only "Munday Library" matched. Fix: added nickname matching across all buildings.
Some users missed the filter buttons entirely (gray-on-gray). Fix: increased contrast and added a subtle border.
Users tapped the collapsed bottom sheet to expand it, but the design only supported a swipe. Fix: added a tap-to-expand affordance.
Step 1 of 5
Autocomplete search with typo-forgiving nickname matching across buildings.
Swipe to navigate
07 · Iterate
Before graduating in Spring 2026, I led one final iteration: on-brand colors, expanded search, and a cleaner filter modal. The hero image shows this Spring state, the most polished version of the product at handoff.
Key Spring Updates (my final pass):
After graduation, the remaining student team and university staff continued maintaining the CSV content workflow I set up.
Step 1 of 3
The Spring iteration introduces St. Edward's branding and floating pill menus to maximize map visibility.
Swipe to navigate
Before graduating in Spring 2026, I led one final iteration: on-brand colors, expanded search, and a cleaner filter modal. The hero image shows this Spring state, the most polished version of the product at handoff.
Key Spring Updates (my final pass):
After graduation, the remaining student team and university staff continued maintaining the CSV content workflow I set up.
Step 1 of 3
The Spring iteration introduces St. Edward's branding and floating pill menus to maximize map visibility.
Swipe to navigate
Looking back
Key Takeaways
Stakeholder Pushback is Data
When people resist a feature, I usually have not communicated the research clearly enough yet. Sharing direct quotes from students with disabilities turned the content team into advocates.
Constraints Breed Creativity
Rough, fast wireframe iterations surfaced the winning bottom-sheet pattern quicker than polished mockups would have.
Leading a Team is a Design Skill
I directed UX students to verify data, photograph locations, and audit accessibility. Clear delegation was as important as the wireframes.
Designing for Handoff
Because I was graduating, the MVP couldn't just work. It had to be maintainable. Setting up a CSV workflow for content updates ensured that the remaining team and non-technical staff could continue scaling the MVP without needing a dedicated front-end developer.
What I'd Do Differently
Explore the final high-fidelity prototype and interact with the complete user flow.
Next case study
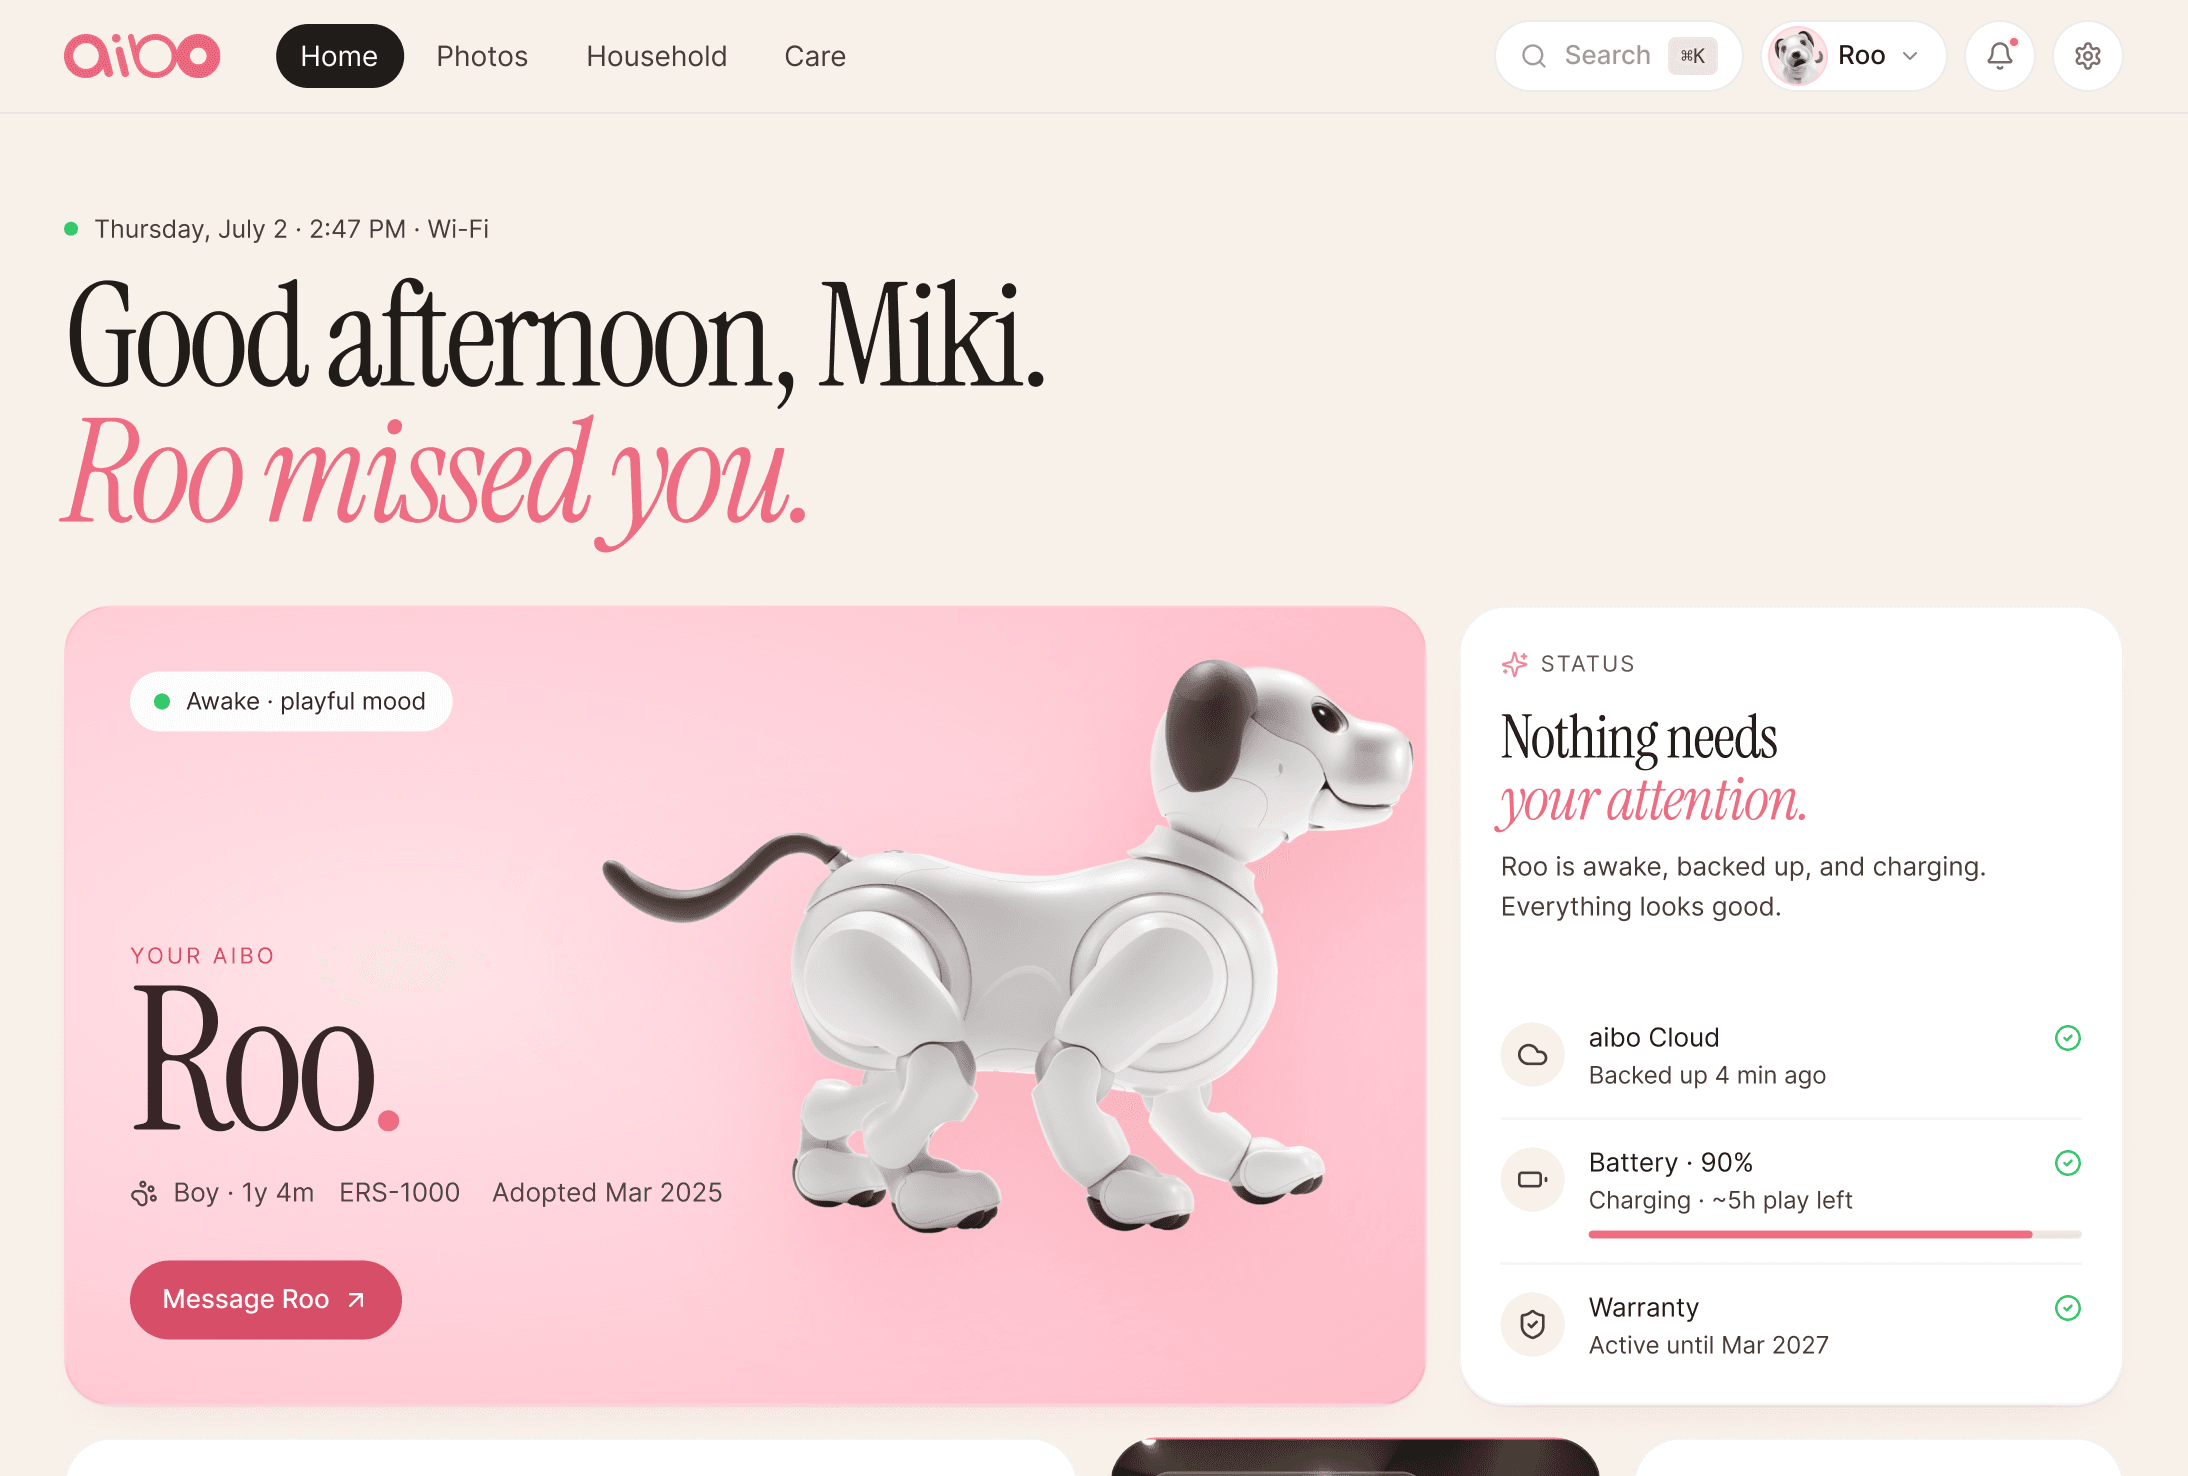
Redesigned Sony's owner portal to prioritize emotional reassurance, solving 8 major UX failures.
Product Designer · Summer 2026, 2-week sprint